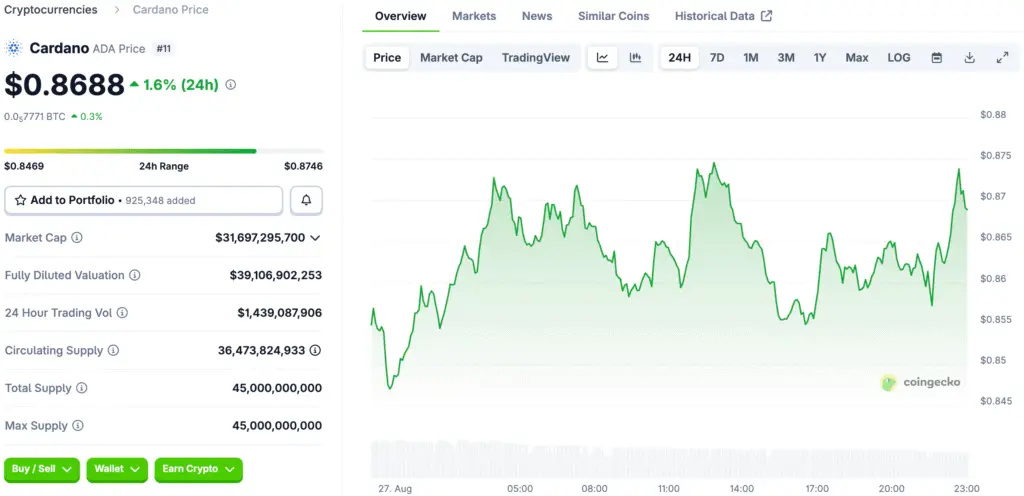
Cardano’s Price at a Critical Juncture
The price of Cardano, or ADA, has reached a critical juncture that could determine its next major move. After a period of bullish momentum, the cryptocurrency now faces its biggest test yet: a key Elliott Wave support level. This is not just a random technical point; it is a make-or-break moment that could either propel ADA to new highs or send it spiraling into a deeper correction.
The current price action is a perfect illustration of the forces of supply and demand at play, with bulls and bears fighting for control at a pivotal level. Understanding the technical significance of this moment is essential for any investor or trader looking to navigate the volatile landscape of the cryptocurrency market.

The Role of Elliott Wave Theory in Analysis
To understand the current price action, it is helpful to look at it through the lens of Elliott Wave theory. This form of technical analysis suggests that asset prices move in predictable patterns, which are influenced by investor psychology. The theory posits that prices move in a five-wave impulse pattern in the direction of the main trend, followed by a three-wave corrective pattern.
In the current context, ADA’s price action is testing a key wave-4 support level, which is a normal and expected part of a larger bullish impulse. According to the theory, a wave-4 correction typically retraces between 23.6% and 38.2% of the preceding wave-3. The fact that ADA has hit this zone perfectly suggests that the current price movement is a textbook correction within a larger bullish trend.
Fibonacci Support and Key Price Levels
A critical component of this analysis is the use of Fibonacci retracement levels. These are horizontal lines that indicate where support and resistance are likely to occur, based on a mathematical sequence. ADA’s price, currently at $0.787, has already touched the 38.2% Fibonacci retracement at $0.786. The price action is now testing the lower end of this zone at $0.756.
This level is not just a random support; it is the line in the sand that separates continued bullishness from a potential disaster. A decisive break below this level would invalidate the Elliott Wave structure and signal a shift in the market’s trajectory. Conversely, a successful defense of this level would confirm the bullish pattern and set the stage for the next leg of the rally.
Projecting an Explosive Rally for Bulls
If the bulls can successfully defend the $0.756 support level, there are multiple upside targets that await. The immediate target sits at $0.808, which is the 1.236 Fibonacci extension. This would be followed by $0.820, the 1.38 Fibonacci extension, and then the more ambitious target of $0.841, the 1.618 extension. The ultimate prize for a successful defense of the support is the $0.856 extension, which represents a potential upside of nearly 9% from the current price.
An explosive rally to these levels would confirm the strength of the underlying bullish trend and likely attract more buyers to the market. This is the scenario that bulls are betting on, and it is a key reason why they are so fiercely defending the current support level.
The Downside Scenario and Potential Losses
While the upside potential is clear, it is also important to consider the downside scenario. If ADA’s price were to decisively break below the crucial $0.756 support, it would shatter the Elliott Wave structure and trigger deeper losses. In this scenario, the price could retrace towards $0.713 or even $0.700, which would represent significant declines.
Such a move would likely be accompanied by a wave of liquidations and a shift in market sentiment from bullish to bearish. For traders, this is a clear stop-loss level, and a break below it would signal that the rally has been exhausted. Understanding this downside scenario is crucial for managing risk and protecting capital.
Why the $0.756 Support Level Matters
The current price action of Cardano is not happening in a vacuum. It is part of a broader market narrative that includes rising institutional interest in a potential ADA ETF, a surge in trading volume, and a growing Total Value Locked in its ecosystem. These fundamental factors provide a strong backdrop for a potential rally.
However, market sentiment remains a key driver, and a break below a critical technical level could override even the strongest fundamentals in the short term. The ongoing battle at the $0.756 support is a clash between technical patterns and investor psychology, and the outcome will provide a clear signal for the market’s future direction.
The Next Move for Cardano’s Price
In conclusion, Cardano’s price is at a crucial make-or-break point. The defense of the key Elliott Wave and Fibonacci support level at $0.756 will be the ultimate test of its recent bullish momentum. A successful defense could lead to an explosive rally towards the $0.856 target, while a break could trigger a deeper correction.
The outcome of this battle will determine the next move for ADA and will provide valuable insights into the broader market’s sentiment. For investors, this is a time to watch closely and make informed decisions based on the price action at this pivotal level.
Read More: Cardano ADA Price Action Signals a Potential Historic Bull Run


