Bitcoin’s Wild Ride Sparks Intense Market Debate
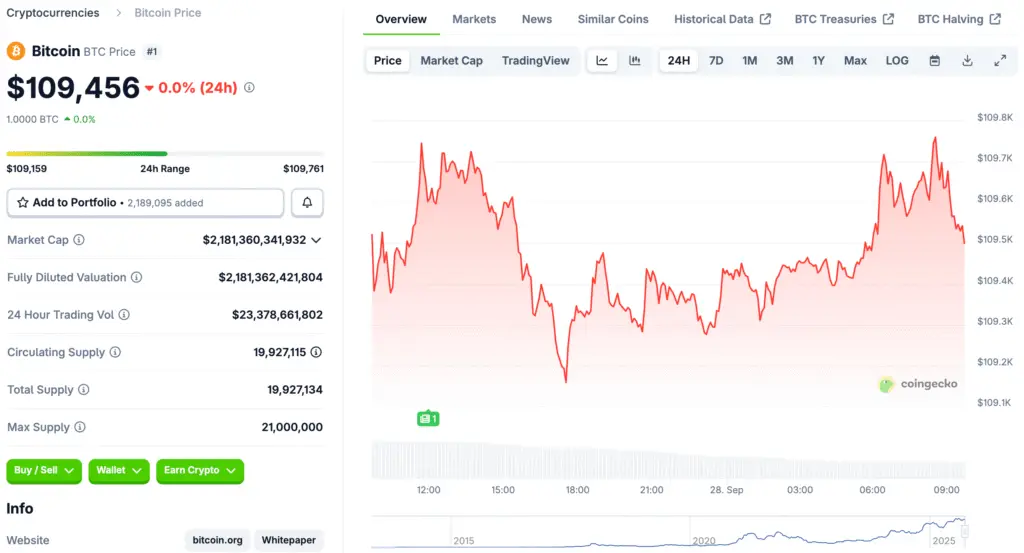
Bitcoin’s recent swings have set traders on edge, forcing heated debates over its immediate trajectory. After hitting record highs, prices slipped quickly, making everyone question whether a crash or new rally awaits. This environment has divided traders into opposing camps, each defending wildly different targets with conviction and urgency.
For some, this is merely a healthy correction that flushes out overleveraged positions. For others, it’s a structural breakdown resembling previous market tops. The outcome will shape not just Bitcoin’s price path but broader crypto market sentiment in the months ahead.

Historical Patterns Point Toward a Sharp Correction
Analysts are drawing comparisons between today’s market structure and Bitcoin’s dramatic 2021 price action. Back then, a euphoric rally peaked before a blow‑off top gave way to devastating declines. Technical charts reveal eerily similar formations today, hinting at the possibility of another deep correction phase looming ahead.
A key element of this comparison is the four‑step structure observed in 2021. Bitcoin surged strongly, met heavy resistance, pulled back to mid‑range support, and then failed on a crucial retest. That failure triggered cascading liquidations, sending prices tumbling more than fifty percent in mere weeks.
Recommended Article: Forget Bitcoin ETFs — This Meme-to-Earn Presale Could Deliver 19,900% Gains
Technical Breakdown Raises Bearish Alarm Bells
Price charts now show Bitcoin slipping below a rising wedge pattern, which often signals bearish momentum building underneath the surface. This formation, characterized by narrowing trendlines, typically appears near the end of bullish cycles before major reversals. Traders monitoring these signals worry that history may be preparing to repeat itself once again.
Analysts highlight that a similar wedge collapse in 2021 initiated a deep drawdown toward long‑term support zones. This time, the 200‑week exponential moving average near $60,000 is emerging as a critical support region. A decisive break below this level could rapidly accelerate selling pressure, catching late buyers completely off‑guard.
Bulls See Strong Support and Macro Tailwinds
Not everyone believes doom is around the corner. Bullish traders argue that Bitcoin’s macro environment is stronger than during previous cycle tops. Federal Reserve rate cuts and improving liquidity conditions could provide a supportive backdrop for risk assets, including cryptocurrencies, in the near term.
Key moving averages around the $104,000–$106,000 zone are acting as firm support during this correction. Historically, these levels often mark mid‑term bottoms during bullish phases. Bulls expect renewed buying momentum once sellers exhaust themselves, potentially igniting the next leg higher toward ambitious price targets.
Traders Eye $140K as Breakout Confirmation Level
Several respected analysts point toward $113,000 as Bitcoin’s immediate resistance zone that could unlock massive upside. A decisive move above this level might confirm the formation of a bullish continuation pattern, often referred to as a bull flag. Such breakouts typically precede explosive rallies in strong uptrends.
If momentum carries Bitcoin past that threshold, traders anticipate an accelerated rally toward $140,000. This would represent a textbook continuation of the broader bull cycle, fueled by growing institutional adoption and increasingly favorable macroeconomic conditions. Bulls argue that current weakness is simply the prelude to that powerful breakout.
Sentiment Split Reflects Broader Uncertainty
Market sentiment remains sharply divided between bullish optimism and cautious skepticism. On social media, influencers and analysts debate chart patterns, fractals, and macro trends with intense passion. The split reflects broader uncertainty about how Bitcoin will react to evolving economic and technical factors simultaneously.
This division isn’t necessarily bad for the market. Differing perspectives create healthy two‑sided liquidity, which can fuel volatile price swings. For traders, this environment offers both opportunity and risk, depending on timing and conviction.
Key Levels Define Bitcoin’s Near‑Term Fate
Ultimately, Bitcoin’s fate hinges on how it behaves around two critical zones: $60,000 below and $140,000 above. These levels now represent battle lines between bears aiming to reverse the trend and bulls pushing for continuation. Whichever side wins this tug‑of‑war will determine market direction into year‑end.
Traders are watching these zones closely, adjusting strategies for both scenarios. Whether Bitcoin crashes dramatically or launches another stunning rally, the coming weeks promise major volatility. Everyone agrees on one thing: Bitcoin is approaching a pivotal moment that could define the next chapter of this bull cycle.


