Bitcoin Price Stabilizes as Anticipation Grows for Possible Breakout
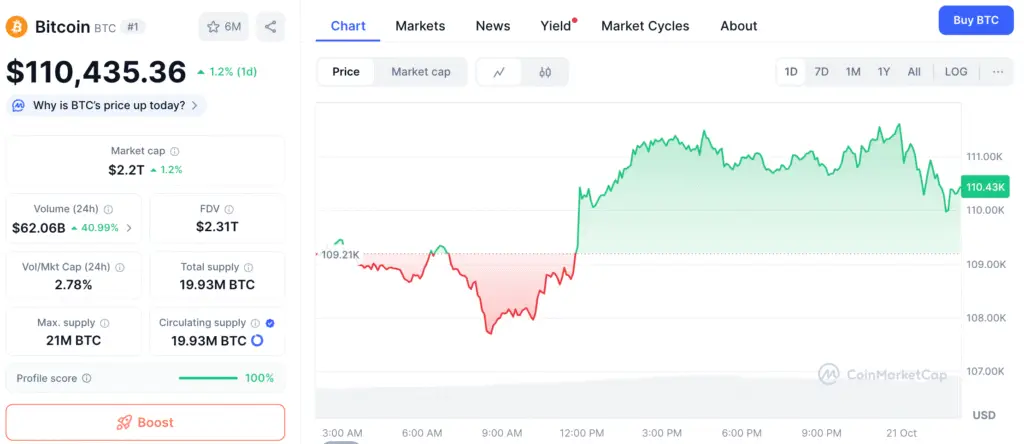
Bitcoin (BTC) maintained a narrow trading range early Monday, oscillating between $110,803 and $111,057 in the last hour. The market capitalization stands at $2.20 trillion, accompanied by a 24-hour trading volume of $55.35 billion. BTC’s tight intraday range, fluctuating between $107,453 and $111,374, has left traders feeling anxious. The situation seems ready for a significant move, whether upward or downward, as fluctuations tighten near crucial resistance levels.
After facing a significant setback at $126,000 earlier this month, BTC made a robust recovery from $103,530, regaining its short-term upward momentum. Market sentiment is clearly split—while there is a sense of optimism above $110,000, the failure to surpass $112,000 indicates a cautious stance before any significant movement.
Daily Chart Indicates a Positive Short-Term Trend
The daily chart reveals a sense of cautious optimism as BTC maintains its position near the $111,000 mark following a significant recovery. The recent drop to $103,530 sparked significant selling activity, indicating robust support from buyers. Experts indicate that a daily close exceeding $112,000 might reveal upward possibilities towards $118,000, whereas a decline beneath $106,000 could undermine the optimistic outlook.
The current momentum is encouraging yet delicate, as various indicators reflect a state of neutrality to moderate vigor. The Bulls are focused on maintaining their recent upward trajectory, while the Bears keep a close watch on resistance levels for possible turnarounds.
Highlights from the Four-Hour Chart Consolidation and Wedge Breakout
On the 4-hour timeframe, Bitcoin shows signs of recovery after breaking out of a falling wedge, a traditionally bullish formation. The level of $103,530 has proven to be a strong support, while the barrier slightly below $113,000 persists in limiting upward movement.
The activity around $111,000, coupled with a decrease in volume, indicates a potential lull before the forthcoming shift. A confirmed breakout above $112,000 accompanied by high volume may drive momentum toward the $116,000–$118,000 range. On the other hand, a pullback to $108,000 could present traders with a more advantageous opportunity to re-enter before a possible upward trend resumes.
Recommended Article: Bitcoin Rally Sparks Altcoin Boom Amid Geopolitical Tensions
Bitcoin Builds Higher Lows but Faces Stiff Resistance at $112K Level
The hourly chart illustrates Bitcoin’s steady ascent, yet it remains hindered by ongoing resistance at $112,000. The presence of higher lows, robust candle formations, and a dependable $108,000 support level suggests a positive framework, even amid temporary stagnation.
The current state of momentum oscillators and indecisive price consolidation indicates that traders are holding back, seeking confirmation before committing to more significant directional positions. A significant increase in volume surpassing $112,000 may lead to a swift ascent towards $116,000, whereas a failure to break through resistance could result in a decline back to $108,000.
Oscillator Readings Signal Market Indecision
Technical oscillators indicate a blend of neutrality and slight bearish sentiment. The Relative Strength Index (RSI) stands at 45, indicating a state of equilibrium in the market. The stochastic oscillator stands at approximately 24, while the Commodity Channel Index (CCI) registers at -71, suggesting a slight downward trend.
The Average Directional Index (ADX) stands at 27, indicating a weak trend environment. Meanwhile, both the Awesome Oscillator (AO) and MACD are in negative territory, recorded at -6,726 and -1,925, respectively. The sole somewhat optimistic signal comes from the Momentum indicator, which is currently at -1,970, suggesting a possible recovery scenario if buying strength reemerges.
Bitcoin Faces Mixed Signals as Short-Term Averages Show Bearish Bias
The 10-period SMA for Bitcoin shows a modest bullish trend at $110,663, whereas the 10-period EMA indicates a bearish inclination around $111,086. In addition to that, the majority of significant moving averages, such as the 20, 30, 50, and 100-period SMAs/EMAs, indicate persistent downward momentum.
Nonetheless, the 200-period moving averages at $108,104 (EMA) and $107,909 (SMA) establish a strong foundation of support. The enduring baselines are essential for maintaining a positive outlook, especially in the face of potential short-term fluctuations.
Optimistic Outlook: A Surge Past $112K Might Aim for $118K
A confirmed break and close above $112,000 may indicate a shift towards positive momentum, with targets positioned between $116,000 and $118,000. The trend of higher lows observed across various timeframes reinforces this perspective, particularly with a notable rise in accumulation volume around the $108,000–$110,000 range.
For continued progress, momentum indicators need to show a positive shift. Should Bitcoin achieve a robust daily close exceeding $112,000, experts predict a resurgence in rally activity fueled by technical breakout traders and the unwinding of short positions.
Bitcoin Consolidates as Momentum Indicators Signal Weakening Trend
Not managing to surpass $112,000 may jeopardize the optimistic outlook, putting BTC at risk of revisiting $108,000 or potentially $106,000. Many key indicators are still pointing towards potential declines, while oscillators are showing a lack of momentum. A significant decline beneath $107,000 could potentially signal the onset of a more profound correction phase.
Market participants are keeping a keen eye on Bitcoin’s forthcoming actions, which may steer the immediate trajectory of the entire cryptocurrency landscape. Until a significant shift takes place, a state of impartiality prevails, with primary attention directed towards the $112,000 breakout threshold and the $108,000 support area.