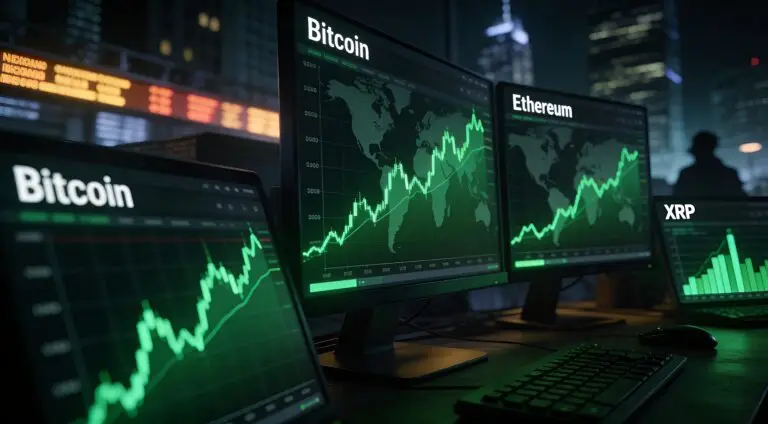
Several technical and on-chain indicators are converging to suggest a significant potential rally for XRP, with targets set towards the $6 milestone before the end of 2025. The current market dynamics, characterized by bullish chart patterns and sustained buying pressure, are fueling optimism among analysts and investors. This renewed interest and the breaking of key resistance levels point to a possible new phase of upward movement for the digital asset.
XRP’s Symmetrical Triangle Breakout Targets $6
Data from Cointelegraph Markets Pro and TradingView indicates that XRP is currently trading above a symmetrical triangle on its daily chart. For the price to continue its upward trajectory, it needs to decisively close above the eight-year high of $3.66. If this occurs, the measured target for this breakout is $6.03. Such a move would represent total gains of 75% from the current price level. Binance Killers noted in a recent X post that the price is now retesting the breakout zone, and a successful bounce from this area would confirm the bullish momentum, setting the stage for further appreciation.
XRP Bull Pennant Eyes $5.80 Next
On the four-hour chart, XRP is displaying a bull pennant formation, with the price currently encountering resistance at the pattern’s upper trend line, around $3.46. A candlestick close above this level would clear the path for XRP to ascend towards the bull pennant’s target of $5.80. This would represent a substantial 67% increase from its current price. A bull pennant is a recognized bullish continuation pattern in technical analysis. It typically forms as a small symmetrical triangle after a sharp price rise, signaling a period of consolidation before resolving with an upward breakout that continues the initial bullish trend.
XRP Spot Taker CVD Shows Buyers in Control
The 90-day spot taker cumulative volume delta (CVD) indicates that buy orders, specifically taker buy volume, have once again become dominant. CVD measures the difference between buy and sell volume over a three-month period. Since early June, demand-side pressure has consistently influenced the order book, with the XRP/USD pair reaching multi-year highs above $3.66 on Friday. A positive CVD, represented by green bars on the chart, signals optimism among bullish traders who anticipate further price increases. If the CVD remains positive, it suggests that buyers are maintaining their strong presence in the market, which could trigger another wave of upward movement, similar to patterns observed in previous bull cycles.
Sustained Demand Despite Recent Rally
The current chart data suggests that more buy orders are being placed in the market than sell orders, despite approximately 99% of XRP holders currently being in profit at the prevailing prices. This strong demand, even after the recent rally, positions XRP favorably for continued upward movement. As Cointelegraph has reported, other technical indicators and chart patterns further suggest that XRP’s full-blown parabolic phase may not have fully begun, reinforcing the altcoin’s potential for further gains over the coming weeks. The combination of these factors paints a promising picture for XRP’s near to mid-term price action.