XRP Price Drops More and Fear Grows
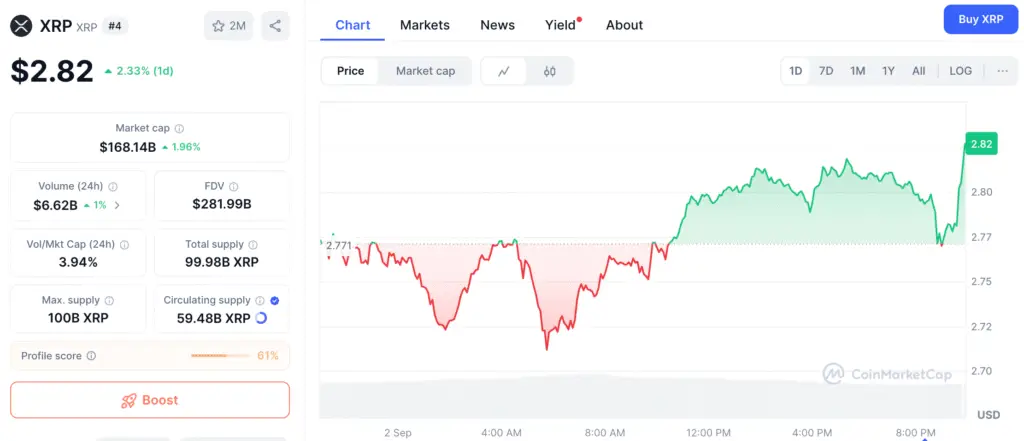
XRP’s price has dropped even more since last week’s big sell-off. The price of the altcoin has dropped 1.78% in the last 24 hours. A lot of people are worried about the risk-off mood in the market as a whole. Less activity on the blockchain also means more losses.
The Crypto Fear & Greed Index is now in the “fear” zone. This shows that investors are becoming more cautious in the market. This fear is a big reason for the way prices are moving right now.
The Price of XRP Is Now Under Pressure
The number of active addresses has dropped, which means that on-chain activity has also dropped. This is a clear sign that the person is less willing to take risks. This makes XRP open to a lot of new selling pressure from investors. A big drop means that people are less willing to take risks.
A big drop in futures open interest is another sign that investors are losing interest. This means that investors aren’t sure what to do. This could make it more likely that the downtrend will continue.
Looking at the Descending Triangle Pattern
The price chart for XRP has been making a triangle shape that goes down. This has been going on every day since its July rally. A flat support level is a key feature of this pattern. It also has a resistance line that slopes down.
A descending triangle that forms after a strong uptrend is a sign that the market is going to go down. The setup is over when the price goes below the flat support. Then it drops by as much as the highest point of the triangle.
Recommended Article: Will XRP Price Drop to $2 or Reverse Its Course
Why the $2.70 Support Level Is So Important
Even though the fundamentals aren’t strong, the technical setup suggests a possible rebound. If the support at $2.70 stays strong, this is possible. If it doesn’t work, there could be a long drop down to $2. Traders need to pay close attention to this level.
The bulls are having a hard time keeping XRP above the triangle’s support line. If they are successful, the price could go up and break the upper trendline. This would show that a new rally and bullish momentum are on the way.
A Possible Bearish Crossover for XRP
The Moving Average Convergence Divergence for XRP also suggests a possible bearish crossover. This could happen in September, which could cause the price to drop to $2.17. A lot of people can see the technical signals very clearly.
The liquidation heatmap shows that people are buying XRP at $2.70. There are also a lot of ask orders sitting between $2.87 and $3.74. This shows a lot of strength.
A Look at the XRP Liquidation Heatmap
There is a lot of new buying going on on the liquidation heatmap. It shows that a lot of people are buying at the $2.70 level. This is a very good sign for the token. This shows that a lot of people are behind this level.
There are also a lot of ask orders between $2.87 and $3.74. This means that these levels are very hard to break through. To go higher, the token needs to break through these levels.
XRP’s Next Big Price Move
The price could go up if the bulls can keep XRP above the triangle’s support. At $3.09, it might break the upper trendline. This would prove that there is a new bullish momentum and a rally. At $3.70, the pattern reaches its peak.
Another sell-off could happen if the price drops to $2.70. The demand zone is the first line of defense. If this level breaks down, XRP will drop to around $2.08.