Polkadot Price Holds Firm Near Key Levels While Traders Watch Closely
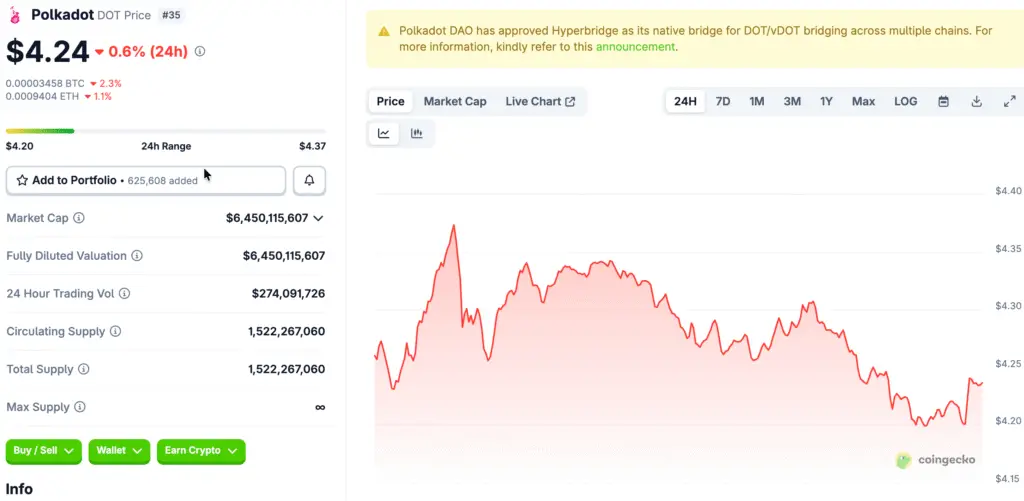
Polkadot is maintaining a stable trading position around $4.24, as market participants keep a close eye on its technical framework for potential breakout indicators. The token’s capacity to stay above key moving averages indicates an increasing level of trader confidence throughout this period of consolidation.
Even with minor tweaks in analyst predictions, the overall mood stays positive, indicating a solid technical base. This resilience strengthens optimistic outlooks, particularly as momentum indicators suggest possible upward trends in the weeks ahead.
Analyst Predictions Show Consistent Outlook Despite Minor Target Adjustments
Several forecasting platforms have consistently shown short-term targets ranging from $4.095 to $4.122, reflecting a strong analytical consensus. This agreement indicates that analysts perceive the current price levels as viable, even as expectations undergo minor adjustments during consolidation phases.
Recent downward adjustments from $4.122 to $4.095 suggest a sense of cautious optimism rather than a strong bearish sentiment among professional market observers. Moderate confidence levels in predictions indicate a positive outlook, reinforcing the potential for upward movement toward elevated targets.
Technical Indicators Strengthen Bullish Case for DOT Breakout Scenario
Polkadot is currently trading above all significant moving averages, including the SMA 200 at $4.03, indicating a robust overall bullish structure. The MACD histogram reading at 0.0171 indicates a strengthening positive momentum, further supported by an expanding gap between the essential MACD lines.
The RSI is currently at 53.51, indicating there is still potential for upward movement before it may reach overbought territory in the future. At the same time, Bollinger Bands show that prices are situated in the upper half, indicating bullish momentum while avoiding any immediate overheating concerns.
Recommended Article: Polkadot Breaks Out as DOT Price Jumps 6% on Big Volume
Bullish Scenarios Highlight Breakout Potential Toward $4.30 and Beyond
The optimistic outlook aims for $4.30 in the next two weeks, indicating a significant breakthrough beyond the recent resistance at $4.38 levels. A breakout of this nature could attract momentum buyers, possibly driving DOT up to $4.50 or even $4.88 in more favorable circumstances.
The ongoing strength in MACD, coupled with a supportive RSI, has the potential to enhance these movements, creating a harmonious alignment of technical and psychological elements. Historical trends indicate that when DOT breaks through resistance levels, subsequent rallies tend to happen swiftly as a result of built-up momentum.
Bearish Scenarios Focus On Key Support Breakdown Risks Near $4.04
The negative perspective starts with a breakdown below the $4.04 support, aligning with the SMA 50 and the consensus among analysts. Falling below this level would undermine the existing bullish momentum and subject DOT to more significant corrective movements towards lower support levels.
Support levels are positioned around $3.77 and $3.61, indicating a potential downside of 10–14% should bearish momentum intensify considerably. A drop beneath the SMA 200 at $4.03 may initiate algorithmic selling, potentially speeding up declines toward historical lows near $3.15.
Strategic Entry Approaches Reflect Different Risk Profiles Among Investors
Traders looking for aggressive opportunities might think about initiating positions close to $4.20, ensuring to set tight stop-loss orders near the $4.04 support level. This approach aims to harness breakout opportunities promptly while reducing downside risk through careful risk management practices.
Participants with a more cautious approach might look for pullbacks in the range of $4.10 to $4.14, positioning their entries in accordance with the support levels of SMA 20 and EMA 12. The appropriate position sizing should indicate a 4% risk to $4.04, while breakouts exceeding $4.38 will serve as confirmation signals for increasing exposure.
DOT Breakout Likely Within Two Weeks as Momentum Indicators Strengthen
Momentum indicators suggest that a breakout effort is likely to occur within the next 1–2 weeks, realistically speaking. If there is no upward movement during this time, we may see a return to consolidation around $4.10, aligning with what analysts are predicting.
Traders are paying close attention to MACD histograms and RSI movements to determine if bullish momentum will continue into the second week. If key indicators continue to show positive trends, DOT may confirm its breakout targets and push gains towards the $4.50 and $4.88 levels.