Avalanche Builds Strength as Q4 Begins
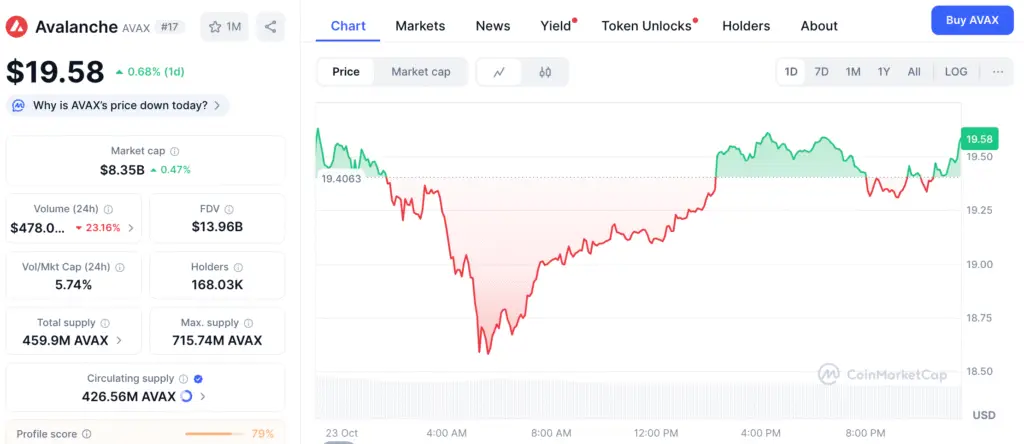
Avalanche (AVAX) is getting market momentum again following weeks of sluggish trade. This shows that investors are more confident going into Q4. The token’s stability above key support areas has drawn positive conjecture, and traders are waiting for confirmation of a breakout phase.
AVAX has done well in the last three months of the year in the past, usually at the same time as other altcoins. People who trade in the market think that the present setup shows signs of early accumulation, which means that prices are likely to rise strongly over the next several months.
Technical Indicators Signal Bullish Continuation
As AVAX moves back into the $20 range and trade volume rises, chart data shows that several bullish patterns are emerging. Technical experts say that the daily chart shows higher lows forming, which means that the market is still in a re-accumulation phase instead of falling down further.
The RSI is over 45 and the MACD histogram is positive, which are both signs that the market is recovering. These signs make it more likely that Avalanche will shortly break over its near-term resistance level of about $22 and keep going up.
DAT Narrative Adds Fuel to the Avalanche Ecosystem
The renewed interest in Decentralized Autonomous Treasuries (DATs) is one of the main reasons behind Avalanche’s recent market activity. DATs add to AVAX’s ecosystem by adding additional decentralized ways to handle money, which makes it more desirable to institutional investors.
This story is similar to past cycles where Avalanche adoption sped up because of new technological integrations. Analysts say that increasing interest in DAT-based governance might lead to more activity on the network, which would help AVAX’s positive momentum.
Recommended Article: Avalanche Market Rebounds as Smart Money Loads Up on AVAX
On-Chain Metrics Show Healthy Market Reset
On-chain data shows that open interest in AVAX derivatives has hit its lowest point in three months, which suggests that leverage has been taken out of the system. This occurrence that lowers risk generally happens before big price recoveries, when spot demand takes the place of speculative holdings.
This view is backed up by historical facts. In the past, AVAX saw big price jumps quickly after leverage resets during comparable times. This supports the premise that less volatility might come before big price increases.
Avalanche Forms Symmetrical Wedge Pattern Mirroring 2021 Breakout Setup
Technical experts have found fractal patterns that keep showing up that look a lot like Avalanche’s breakout configuration from 2021. The chart shows a symmetrical wedge forming, with support and resistance lines coming together. This suggests that the market is in a compression period before it expands.
If this trend is verified, it means that Avalanche might follow its past path and aim for the $45–$55 level in the next few months. If the price goes over $22, this fractal alignment will be confirmed and a new upward cycle will begin.
Weekly Indicators Support Accumulation Phase
Weekly indications indicate hints of recovery over longer periods, especially the Stochastic RSI, which has fully reset and is curving up. These kinds of signs usually happen at the beginning of accumulation stages that come before big market growth.
Analysts see the setting as inherently positive as long as AVAX stays between $19 and $20. When these areas stay strong for a long time, it usually means that buyers are slowly taking back control from short-term sellers, which leads to multi-week upward runs.
Avalanche Outlook: Path Toward $55 and Beyond
Avalanche’s present price structure lines up with a number of positive factors, such as lower leverage, a stronger RSI, and good seasonal patterns for Q4. These things all work together to create a strong base for more upward movement.
If AVAX stays above $20 and smashes over the $22 resistance level, traders expect objectives between $28 and $30 in the near future. The fractal projection suggests a long-term rally toward $45–$55, similar to past market cycles that witnessed tremendous performance at the end of the year.