Ethereum Price Holds Ground Below $4,000
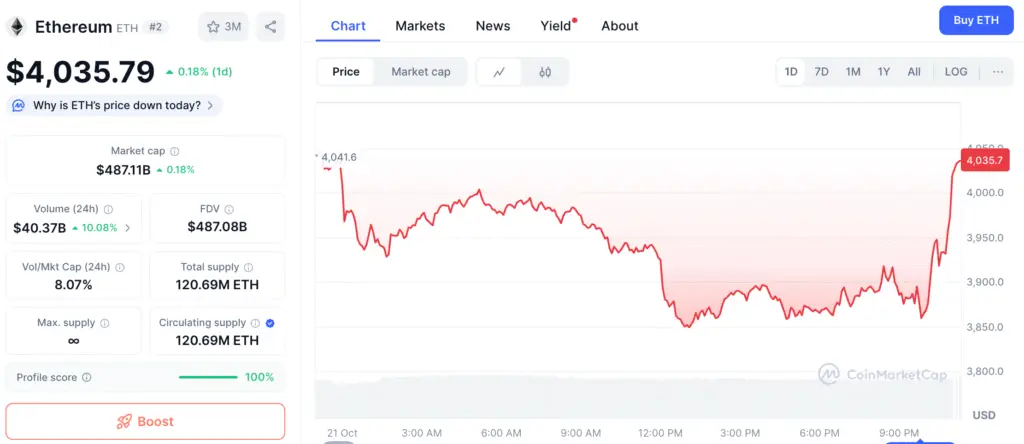
Ethereum (ETH) is still having trouble getting beyond the $4,000 threshold following a week of little price movement. The asset is trading at about $3,935, which is about 6.6% less than it was last week. This is because the momentum of big cryptocurrencies is slowing down. Ethereum is still on the rise in the long run, even though it has pulled back. However, the market’s reluctance shows that it needs stronger confirmation over critical resistance levels.
Market watchers say that the current pullback shows both caution on the blockchain and a lot of supply near $4,000, which is where many traders are still keen to grab gains.
Whale Activity Adds Pressure on Price Stabilit
On-chain data shows that the biggest holders of Ethereum have sold some of their coins, which adds a little bit of selling pressure. Whale addresses sold 140,000 ETH, or over $550 million, between October twenty and twenty-one. This silent distribution has slowed its upward momentum and made it less likely that new investors will join.
The Holder Accumulation Ratio (HAR), which shows the proportion of wallets that are adding to their balances, has stayed at 30.77%. This suggests that investors are waiting for a clear breakout before getting back in. The slowdown shows that short-term confidence has dropped while long-term sentiment is high as the market looks for clearer guidance.
Ethereum Faces Heavy Supply Wall Between $3,955 and $4,314 Zones
The Cost Basis Distribution (CBD) map for Ethereum indicates that there is a lot of supply between $3,955 and $4,015, where more than one million ETH changed hands. This range functions as a “supply wall,” and traders are inclined to sell when the price tests breakeven marks again.
Between $4,270 and $4,314, there is an even stronger resistance range that has held about 1.33 million ETH in past trades. ETH has to break over these overlapping zones to confirm a bullish turnaround. Until then, any move toward $4,000 might cause further selling.
Recommended Article: Ethereum Surges as $205M Inflows Defy Market Volatility Fears
Technical Setup: $4,340 as the Real Breakout Level
From a technical point of view, Ethereum’s larger chart is still leaning toward the bull side. The asset is still following an upward trendline that started in early August, and Fibonacci retracement levels are becoming higher. The 0.618 Fib level is close to $4,200, and the 0.786 level, which is the real breakout confirmation point, is about $4,340.
If the market closes over $4,340 every day, it will break above the existing barrier and launch a fresh upward run that might reach $4,520 and $4,960. ETH is still stuck between support around $3,880 and resistance near $4,000 until that breakthrough happens.
Ethereum Momentum Builds With RSI Divergence and Historical Parallels
Ethereum’s momentum structure suggests that it might rebound, even though the price has been stuck. The Relative Strength Index (RSI) shows a hidden bullish divergence, which means that the price is making higher lows while the RSI is making lower lows. This is generally a hint that purchasing strength is gathering quietly under surface weakness.
Ethereum rose 24% over a comparable setting from August to September 2025, almost reaching its previous all-time high of about $4,880. If the same pattern happens again, a breakout from these levels might lead to comparable gains if the $4,340 mark is broken.
Whale Distribution and Profit-Taking Delay the Next Move
People in the market are still being careful as whales and short-term holders make money at the $4,000 mark. Analysts say that Ethereum’s poor performance this month may be due to money moving away from larger cryptocurrencies and into smaller ones and new DeFi tokens like Remittix. But on-chain indicators still reveal that the network is robust, with gas use and staking participation still high.
Long-term investors see the present consolidation as a normal element of the accumulation phase that will lead to a bigger upward move later in the fourth quarter.
Ethereum Balances Between Support and Potential Bullish Reversal Zone
Ethereum’s long-term bullish structure will depend on if it can keep support above $3,880. If it breaks below that level, the next support level is around $3,680. However, if it stays above that level, ETH may be ready for a greater surge in November.
Ethereum might eventually challenge the $4,340 barrier zone, which is where its next big breakout will happen, if whales start buying again and retail momentum picks up again. The market is keeping a careful eye on ETH right now as it balances between consolidating and perhaps starting a fresh rising phase.