XRP’s Price and a Crucial Barrier
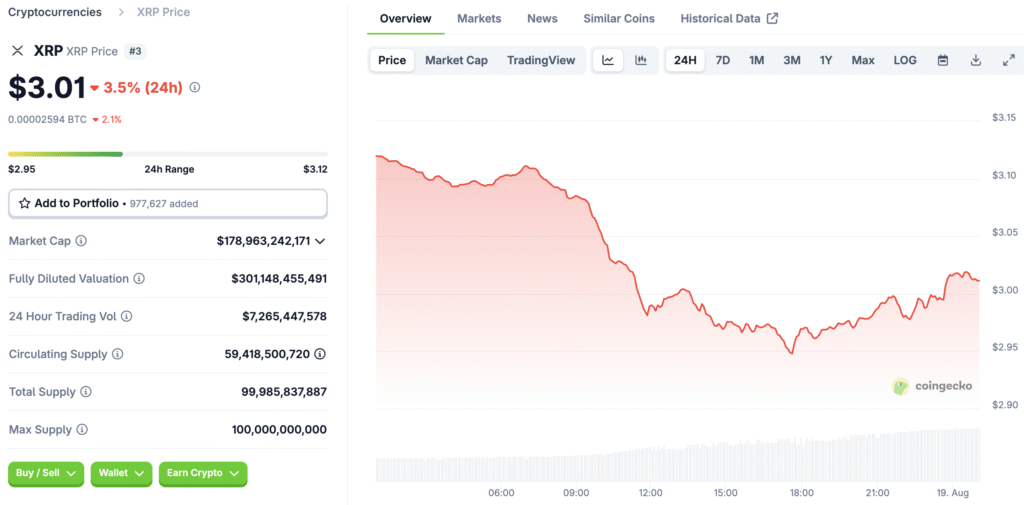
For many traders and investors, the price of $3 for XRP is not just a number on a chart; it is a crucial psychological and technical barrier. After a period of impressive gains, the recent sell-off has pushed the asset back below this key threshold, creating a sense of anxiety and uncertainty in the market. The $3 mark represents a major line in the sand for bulls. A successful defence of this level could signal a continuation of the upward trend, while a sustained drop could trigger a fresh wave of selling pressure.
Historically, such significant price points act as strong psychological anchors, and breaking below them can lead to a domino effect of liquidations and profit-taking. This makes the current price action particularly important for both short-term traders and long-term holders of XRP. The battle for $3 is, in essence, a battle for market sentiment.
A Closer Look at Recent Price Movements
Over the past week, XRP has shown significant weakness, declining by 5% and falling to a trading price below $3. This recent movement is particularly concerning when viewed in the context of broader technical analysis. The price had been consolidating within a symmetrical triangle pattern on the daily candle chart. Symmetrical triangles often indicate a period of indecision, with bulls and bears fighting for control.
However, a breakdown from this pattern, as XRP has recently experienced, typically suggests that the bears have won and that a more significant downward move is likely to follow. This breakdown below the triangle’s support line at $3.00 puts the price at a higher risk of further declines, potentially erasing many of the gains from the previous rally. The market is now keenly watching for a bounce back, but without a swift recovery, the current trend could become deeply entrenched.
Technical Indicators Pointing to Bearish Momentum
The bearish sentiment is not just anecdotal; it is clearly reflected in several key technical indicators. The Relative Strength Index (RSI), a popular momentum oscillator, has been on a downward trajectory. In the past week alone, the RSI has dropped from 61 to 45. The RSI measures the speed and change of price movements, and a reading below 50 generally suggests that the asset is losing bullish momentum and could be headed for a downtrend.
A continuous decline in the RSI confirms that sellers are gaining strength and that buyer demand is waning. Another indicator of concern is the lack of volume on the demand side, which further supports the notion that the current price action is driven more by selling pressure than by a lack of interest.
Understanding On-Chain Metrics and XRP Demand
Technical analysis is not the only source of bearish signals. On-chain data, which provides a more transparent view of market activity, also suggests trouble for XRP. A key metric to watch is the Spot Taker Cumulative Volume Delta (CVD). This indicator measures the difference between buy and sell volume over a specific period, in this case, the last 90 days. Since late July, the spot taker CVD for XRP has turned negative, indicating that sell orders have become dominant on the order book.
This is a clear signal of waning demand and aggressive profit-taking by traders. When the CVD remains in the red, it suggests a continued imbalance between supply and demand, with sellers consistently taking control. This dynamic can set the stage for further price corrections as the market struggles to find sufficient buying pressure to absorb the sell-side volume.
A Historical Precedent for Current Price Action
The current situation is made even more precarious by a historical precedent that investors cannot ignore. The last time XRP saw a high-volume close below the psychological $3 level was in January. That event was followed by a sharp and significant 50% price drop, which led to the asset bottoming out at $1.61 in April. The market is now watching to see if history will repeat itself.
A daily close below $3 could trigger a similar cascade of selling, with traders who bought at higher prices now looking to exit their positions to cut their losses. The fact that an overwhelming 94% of the XRP supply is currently in profit at today’s prices adds another layer of risk. Historically, such high levels of profitability have often aligned with price tops, as traders begin to take profits, leading to increased sell pressure and potential price corrections.
Key Support Levels to Watch for a Potential Rebound
Given the current bearish outlook, it is crucial for investors to monitor several key support levels. The first line of defence sits between the 50-day Simple Moving Average (SMA) at $2.94 and the local low reached on August 2 at $2.72. A bounce from this zone could signal a short-term relief rally. Should this support fail to hold, the next major area of interest is between the 100-day SMA at $2.60 and the 200-day SMA at $2.45.
Losing this critical support would be a major setback for the bulls and would likely bring the price down to the $2.24 level, which is where the July rally began. The price action at each of these support zones will provide valuable clues as to the asset’s future direction.
Navigating the Current XRP Market Outlook
The current market outlook for XRP appears to be bearish, with multiple technical and on-chain indicators suggesting that a deeper correction is on the horizon. The recent drop below the pivotal $3 level, combined with a weakening RSI and a negative spot taker CVD, paints a clear picture of an asset that has lost its bullish momentum.
While a swift recovery back above $3 could invalidate this bearish thesis, the path of least resistance currently appears to be downward. Investors should exercise caution and closely monitor the key support levels mentioned above. This is a challenging period for XRP bulls, and the coming days will be critical in determining whether they can mount a comeback or if the asset is headed for a more significant drawdown.