Ethereum Price Declines But Momentum Hints at Recovery
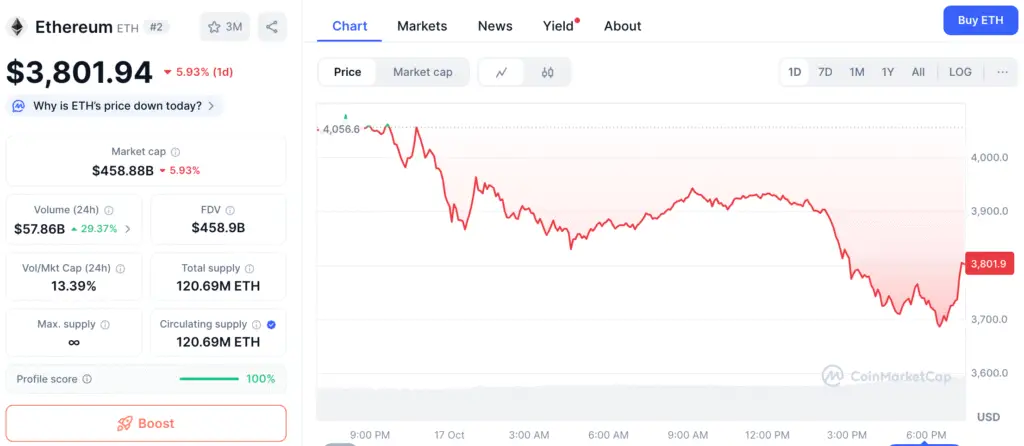
Ethereum (ETH) remains under significant pressure, having dropped nearly 9% this week and almost 10% this month, mirroring the overall weakness in the market. On October 17, 2025, ETH was traded at approximately $3,929, reflecting a daily decline of 2.33%. The price fluctuated throughout the day, ranging from $3,877 to $4,076. Even with this downturn, current technical indicators imply that the downward momentum may be losing strength.
The token’s market capitalization stands at around 7.87 trillion Indonesian rupiah, with daily trading volume increasing by 1% to roughly 735.53 trillion IDR, indicating ongoing engagement from both institutional and retail investors. Experts emphasize that these data points correspond with Ethereum’s past patterns prior to significant recoveries.
Bullish Divergence Resurfaces After Six-Month Gap
The Relative Strength Index (RSI) has established a bullish divergence, as prices exhibit lower lows while the RSI indicates higher lows. This indicator has traditionally foreshadowed possible shifts in trends, suggesting that the pressure to sell may be diminishing.
Previously, Ethereum exhibited this pattern from March 10 to April 21, resulting in an impressive 84.46% surge. Current conditions are reflecting a similar trend, as momentum indicators imply that the market could be gearing up for another notable upward movement.
Ethereum Sees $603 Million Inflow as Institutional Whales Boost Holdings
Recent on-chain data reveals that significant holders of Ethereum, those with substantial wallets containing millions in ETH, are gradually expanding their investments. From October 14 to October 16, the holdings of significant investors increased from 100.36 million ETH to 100.51 million ETH, marking an accumulation of 150,000 ETH, which is approximately $603 million at present market values.
This intentional and consistent purchasing trend indicates a gathering of institutional interest. Historically, this type of whale activity tends to signal impending market reversals, as informed investors strategically position themselves during periods of low volatility.
Recommended Article: Ethereum Leads Developer Growth, Surpassing Solana and Bitcoin
Ethereum Exchange Withdrawals Hit Highest Level Since Late September
In line with this trend, data from Glassnode indicates that Ethereum’s Exchange Net Position Change decreased from -1.55 million ETH on October 10 to -1.94 million ETH on October 15, reflecting a 25% rise in outflows.
When this metric shows negative values, it suggests that there is a greater withdrawal of ETH from exchanges compared to deposits. This trend indicates that investors are transferring their assets into cold storage or staking, which in turn diminishes sell pressure. This represents the peak outflow level since September 25, strengthening the case that investors anticipate an increase in value.
Ethereum Tests Key Resistance Zone While Bulls Target $4,947 Highs
ETH is currently encountering immediate resistance around $4,076, with additional levels at $4,222 and $4,557 to watch for. A 12-hour candle closing above $4,076 would probably signal a bullish reversal, paving the way toward the $4,752–$4,947 range, which corresponds with the all-time high area.
On the negative side, essential support is positioned between $3,952 and $3,877. Failing to maintain control over this region may lead to additional declines toward $3,640, undermining the optimistic outlook. Currently, sustaining a level above $3,877 preserves the potential for recovery.
Technical Configuration Reflects March Surge Pattern
The current chart of Ethereum reflects the pattern observed before its March surge, where a divergence in RSI, coupled with whale accumulation and decreasing exchange reserves, led to a significant rebound. The same trio of optimistic signals has now resurfaced, prompting experts to anticipate a possible multi-week surge if resistance thresholds are surpassed.
Observers of the market contend that the ongoing accumulation by significant stakeholders, coupled with a reduction in available supply on exchanges, indicates an increasing level of investor confidence, even in the face of short-term fluctuations. This combination has historically indicated a continuation of upward movement following the breach of significant resistance levels.
Ethereum Eyes Bullish Reversal as Price Targets $4,222 Breakout Zone
Ethereum’s bullish divergence may be confirmed if it surpasses $4,076, with a move towards $4,222. A breakthrough at $4,557 could signal a shift from a corrective phase to a rising trend. Conversely, a decline in support around $3,877 could reveal the lower limit at $3,640, where renewed buying interest might surface.
October has traditionally been a favorable month for Ethereum, with exchange withdrawals often reducing supply. This unique technical scenario suggests a reversal, especially if the $4,076 threshold is decisively breached.